
Extracting the maximum intensity curve from the image#
The extraction of the maximum intensity arc is not as trivial as in the smooth-gradient MHD case. This will not change when introducing the SXI FOV and the satellite’s POV, but it will improve since the instrument never points directly to the cusps, while image processing techniques can also be applied to extract continuous arcs.
Constructing the images#
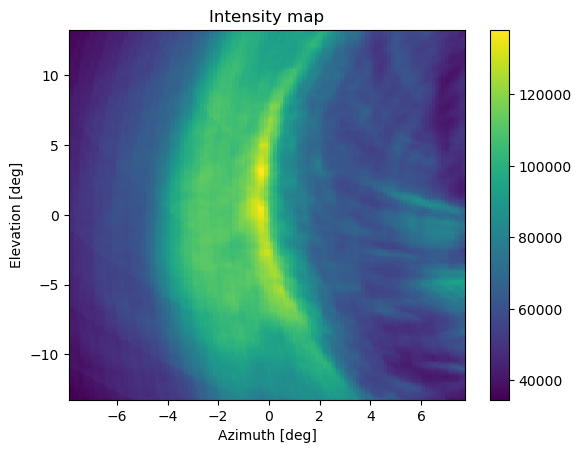
Fig. 11 Typical synthetic image.#
To construct the synthetic images of the SXI instrument, we use the 3DView open-source tool developed by CDPP [Génot et al., 2018]. Through this tool we can simulate the orbit and attitude of the satellite for a specified interval, as well as the orientation and characteristics of the imaging system in relation to the satellite. We can directly import the emissivity cubes of the simulations, introduce the satellite and the FOV of the imager, and compute the integrated flux over each pixel’s LOS. We therefore get the integrated images from each POV of the orbit, according to the FOV and resolution of the imager, as shown in [Génot et al., 2018]. No simulated noise has been added to account for the detection system of the instrument or the background contribution. A typical synthetic image of the magnetopause, generated through this method, is shown in Fig. 11
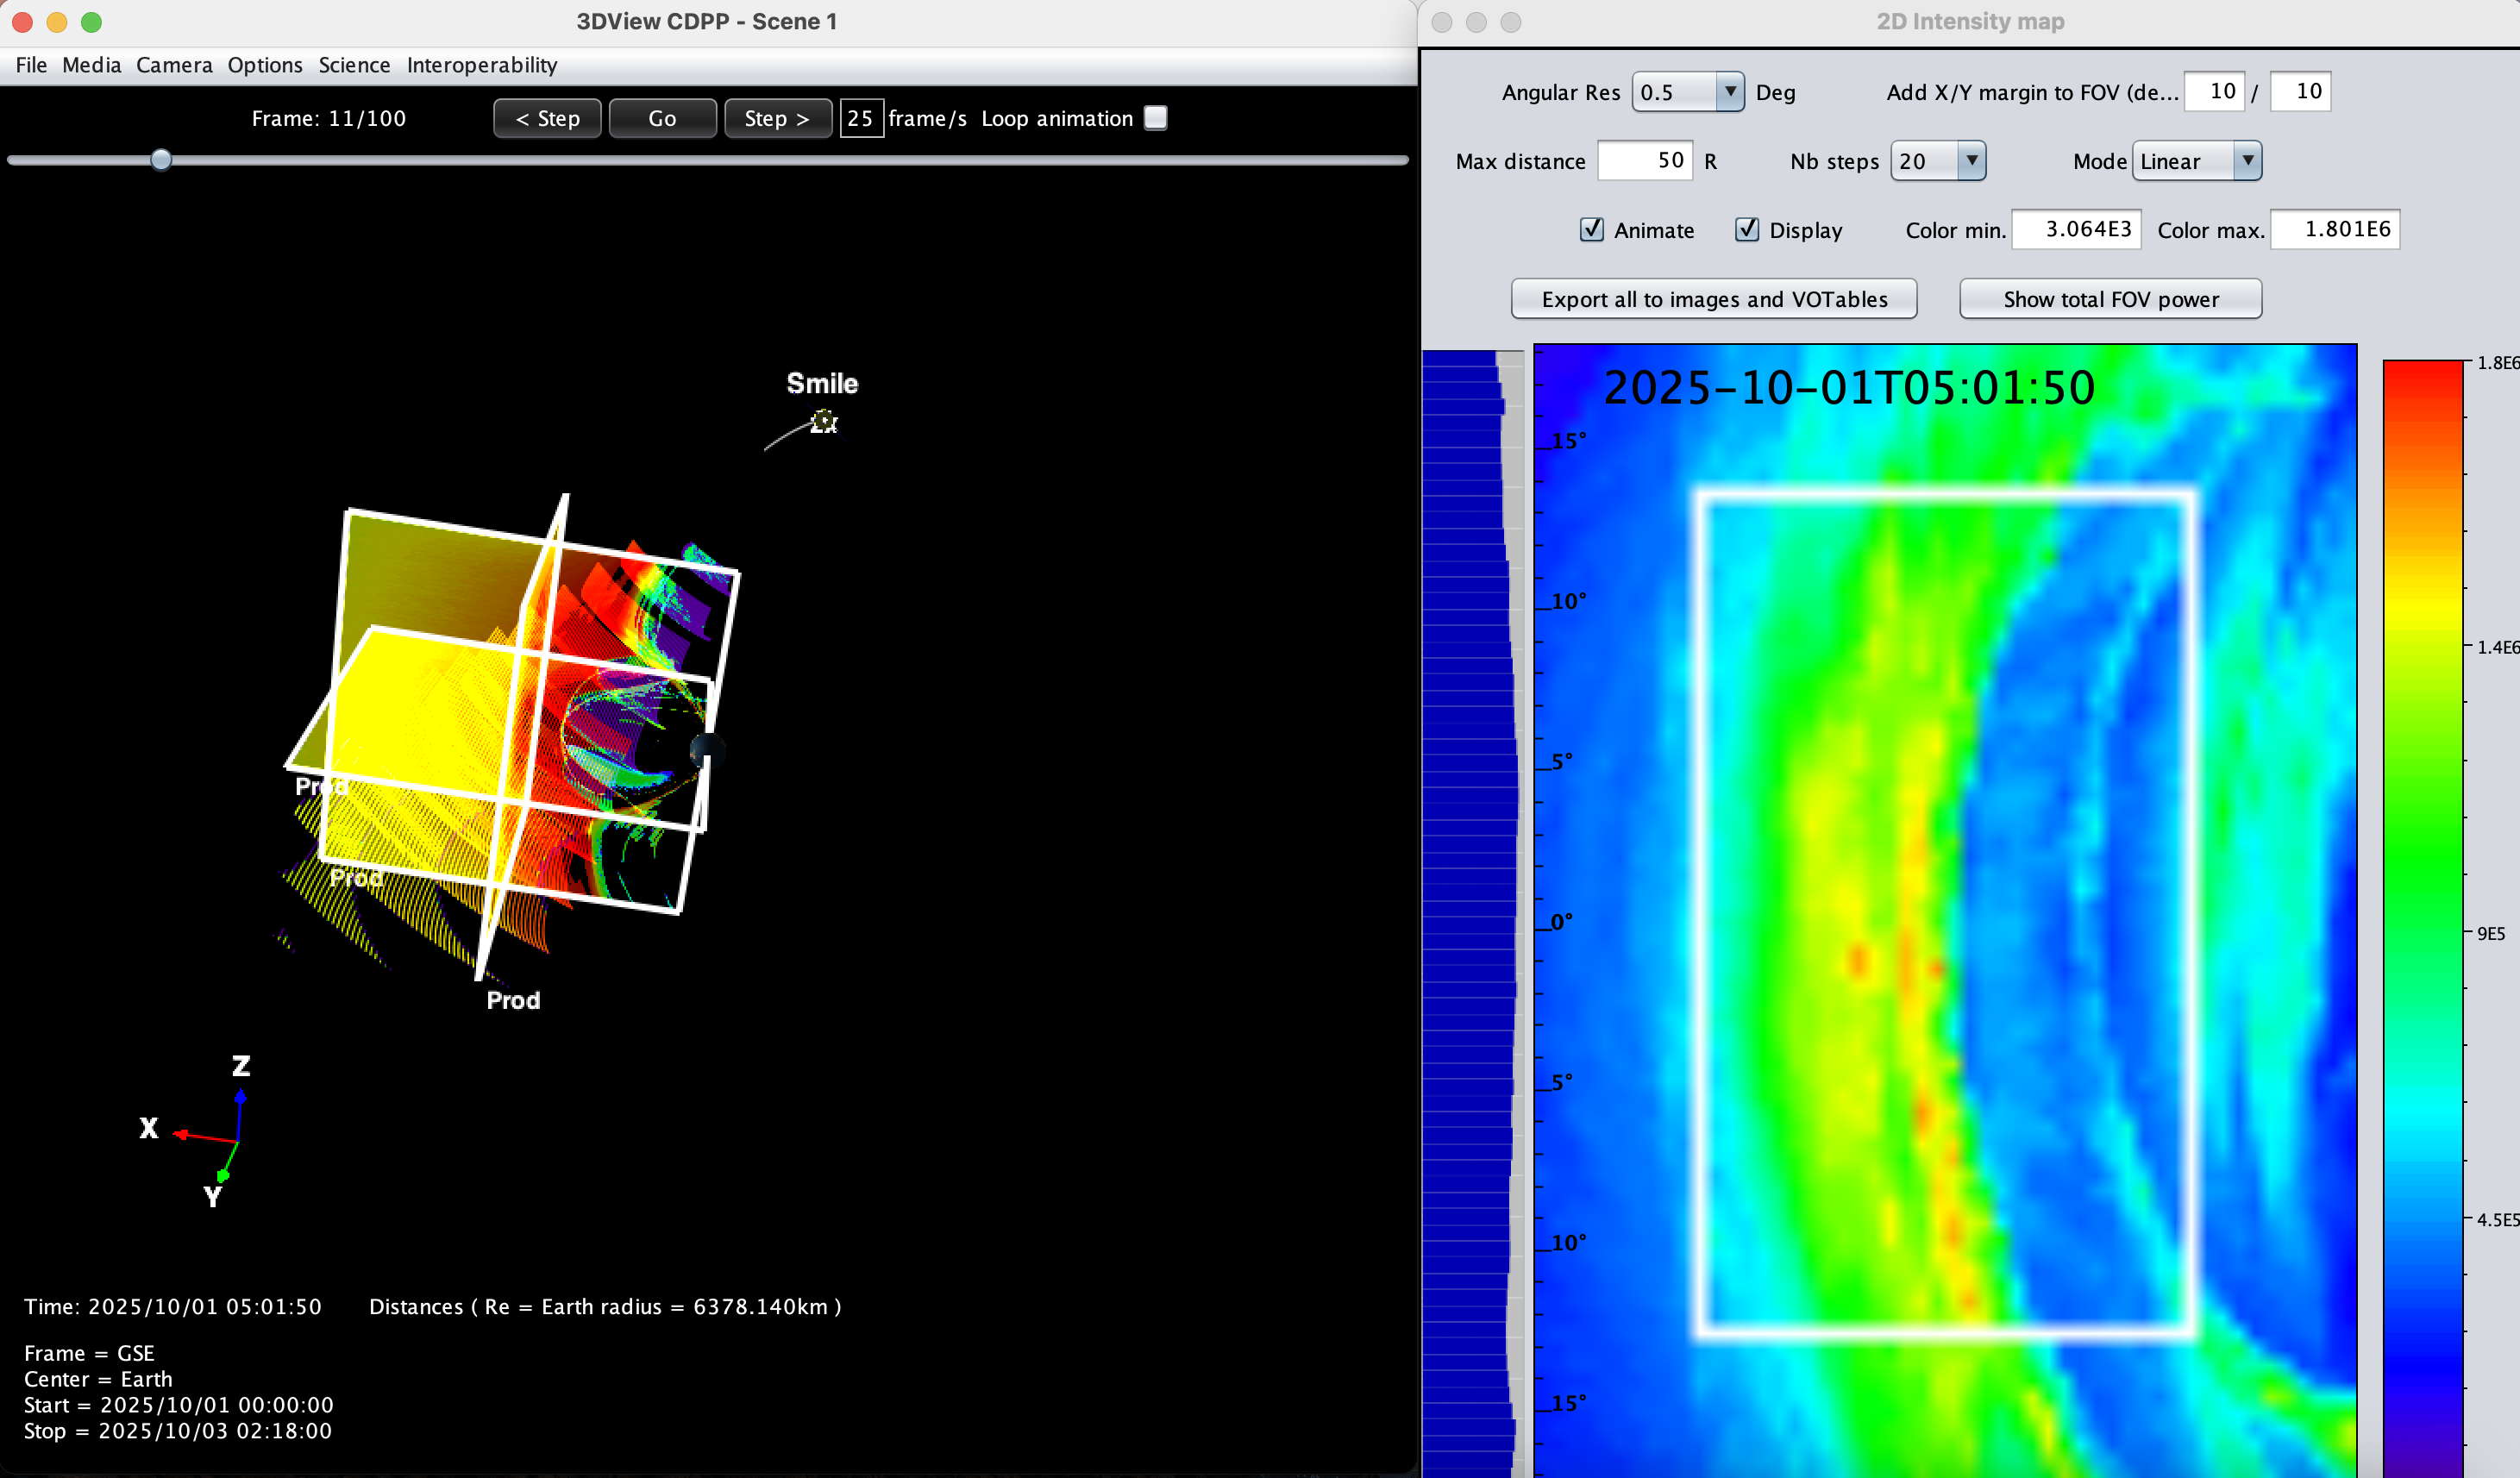
Fig. 12 3D View CDPP software#
Along with the images, we can export XML files that contain information about the position and orientation of the satellite, for each time-step. This will be particularly useful in Characterizing the tangent hypothesis.
You can find the class Images along with methods for reading the images (read_images) and the positions (read_satellite_pos_att) under the TangentFitting.py script.